
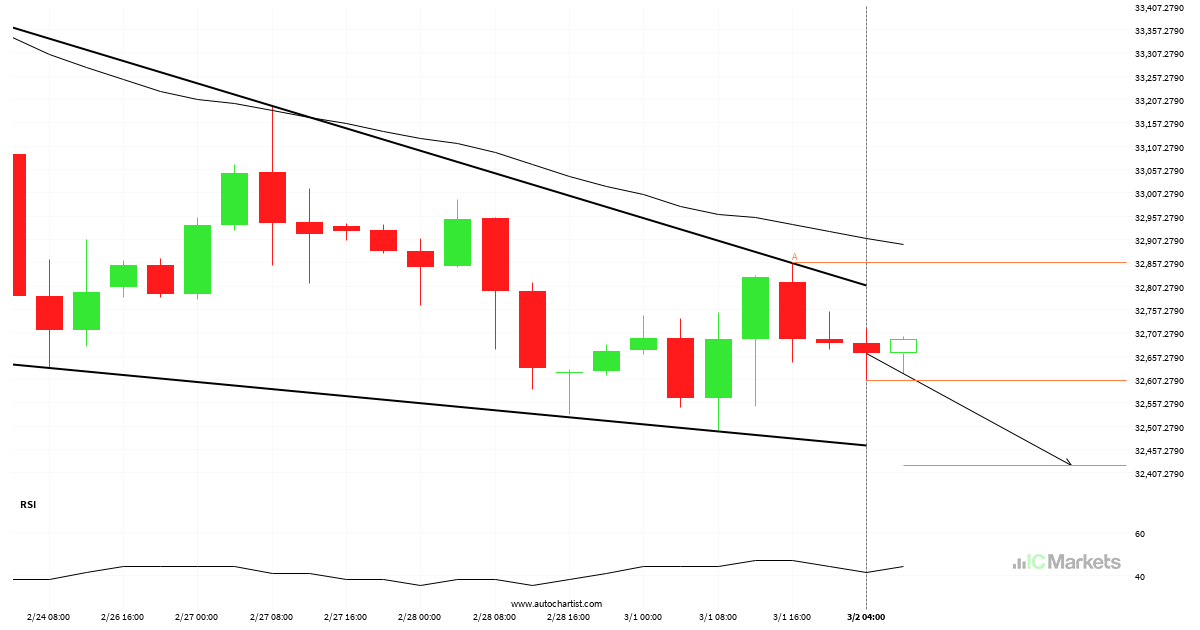
El US Wall Street 30 Index se aproxima a el soporte de un Cuña descendente
El US Wall Street 30 Index se está acercando a la línea de soporte de un Cuña descendente. Ha llegado a esta línea en numerosas ocasiones durante los últimos 11 días. Si vuelve a probarla de nuevo, debería hacerlo en las próximas 2 días.
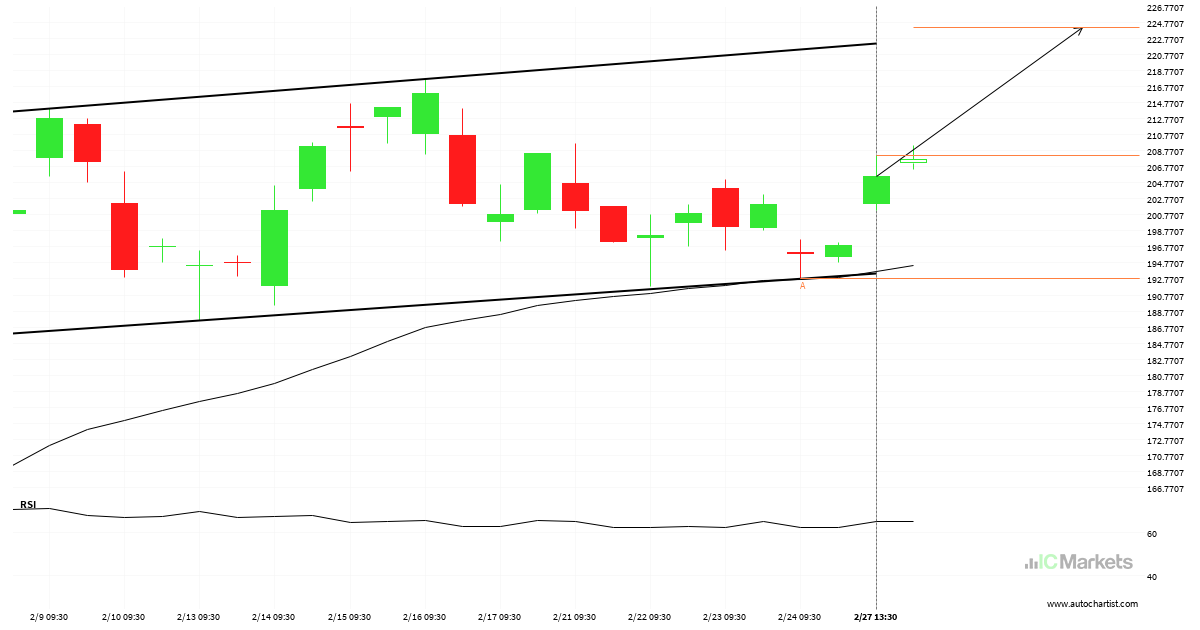
Inminente recuperación o irrupción del Tesla Inc.
El Tesla Inc. se dirige a la línea de resistencia de un Bandera. Si este movimiento se mantiene, el precio de Tesla Inc. podría probar el nivel de 224.0475 en las próximas 23 horas. Ya ha probado esta línea en numerosas ocasiones, por lo que este movimiento podría durar poco y terminar recuperándose, igual que […]
US Tech 100 Index – acercándose a el soporte del Cuña descendente
El US Tech 100 Index avanza hacia una línea de soporte. Como le hemos visto retroceder desde esta línea anteriormente, podríamos presenciar, o bien, una ruptura a través de esta línea o una recuperación a los niveles actuales. Ha llegado a esta línea en numerosas ocasiones en los últimos 17 días y puede probarla de […]
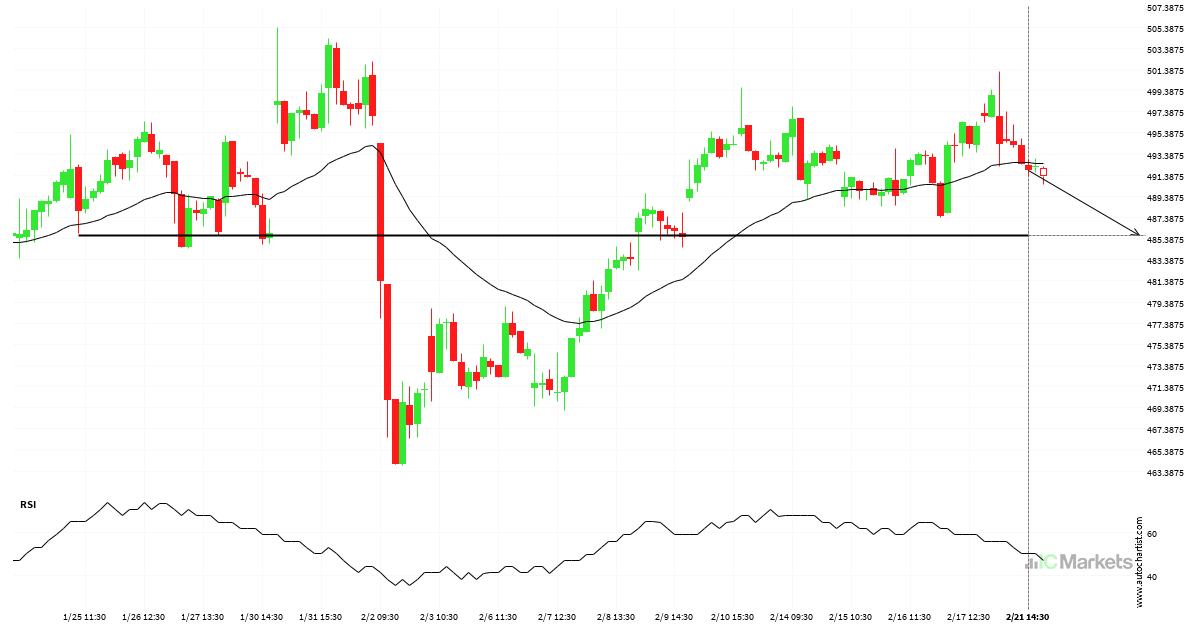
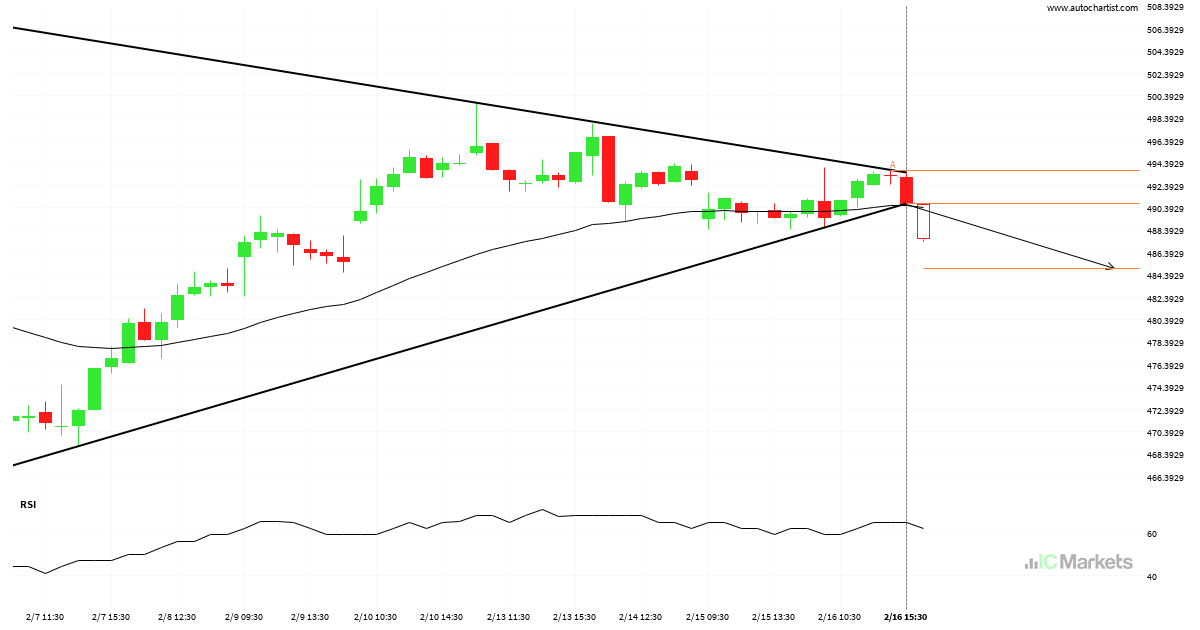
Un posible impulso final en el Unitedhealth Group Inc.
El Unitedhealth Group Inc. avanza hacia 485.7150 y podría alcanzar este punto en un plazo de 2 días. Ha probado esta línea previamente en numerosas ocasiones y esta vez no tiene porqué ser diferente, terminando con una recuperación en lugar de en una rotura. Si la rotura no ocurre, podríamos observar un retroceso de nuevo […]
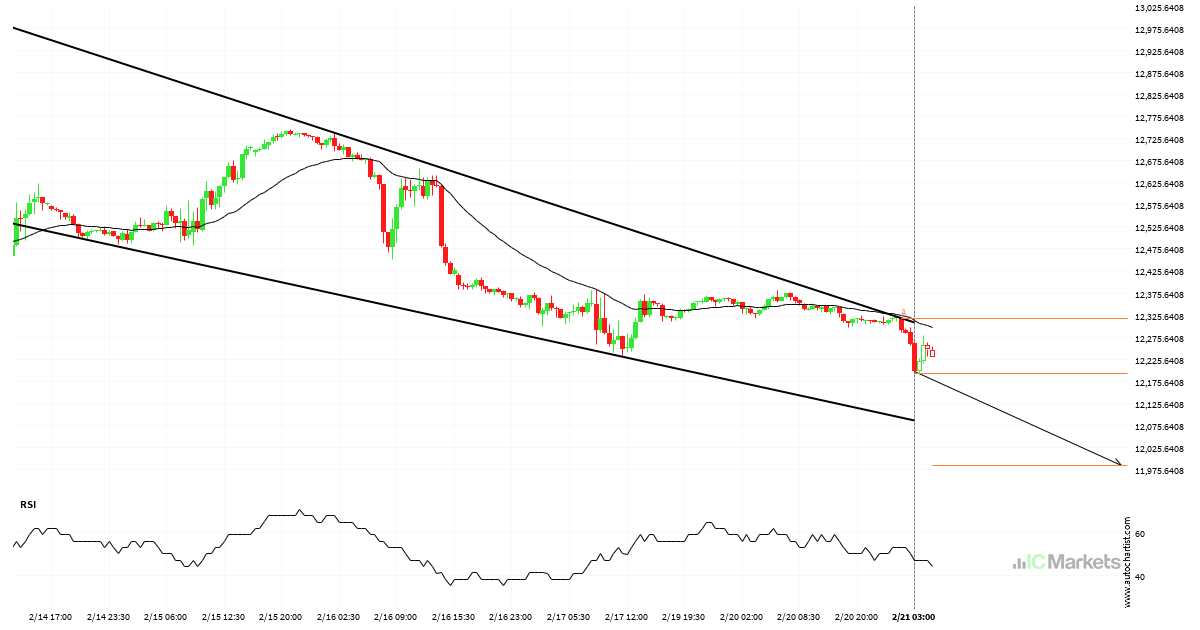
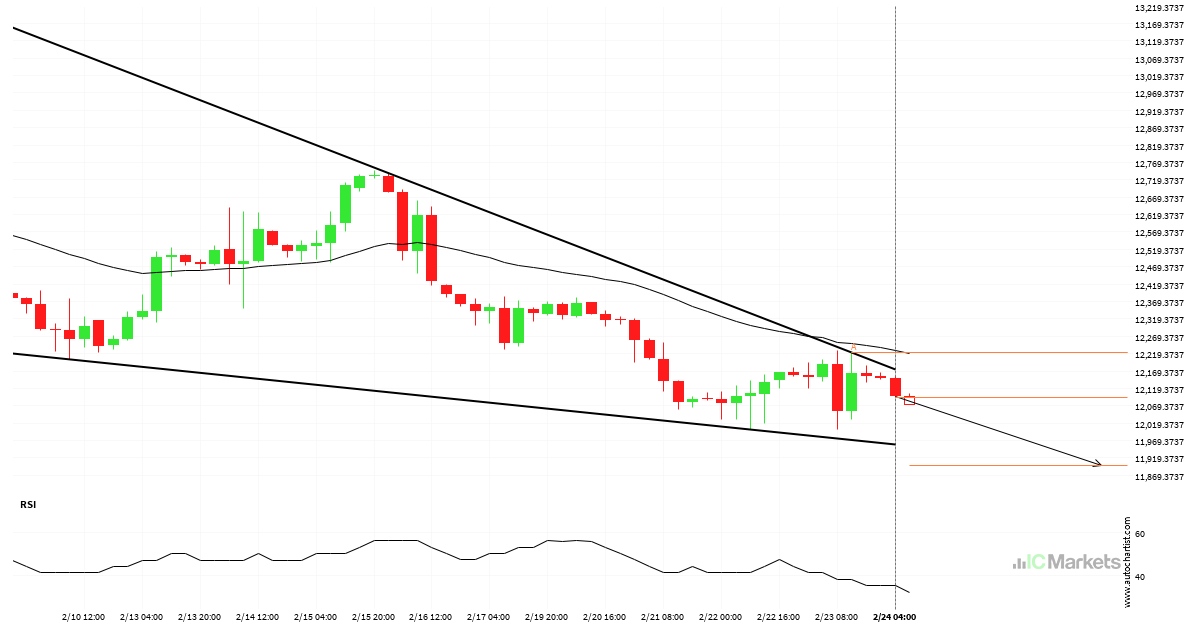
Inminente recuperación o irrupción del US Tech 100 Index
El US Tech 100 Index se dirige a la línea de soporte de un Cuña descendente. Si este movimiento se mantiene, el precio de US Tech 100 Index podría probar el nivel de 11985.9727 en las próximas 2 días. Ya ha probado esta línea en numerosas ocasiones, por lo que este movimiento podría durar poco […]

O bien, una inminente recuperación o una ruptura del US Small Cap 2000 Index
El US Small Cap 2000 Index avanza hacia la línea de 1981.4900. Si este movimiento se mantiene, el precio del US Small Cap 2000 Index podría probar el nivel de 1981.4900 en un plazo de 7 horas. Pero no se apresure a la hora de operar, porque el par ha probado esta línea en numerosas […]
El Unitedhealth Group Inc. ha atravesado el soporte
El Unitedhealth Group Inc. atravesó una línea de soporte. Ha entrado en contacto con esta línea por lo menos dos veces en 17 días. Esta ruptura puede indicar un movimiento potencial a 484.9572 en 15 horas. Como ya vimos un retroceso de esta posición en el pasado, debemos esperar la confirmación de la ruptura antes […]
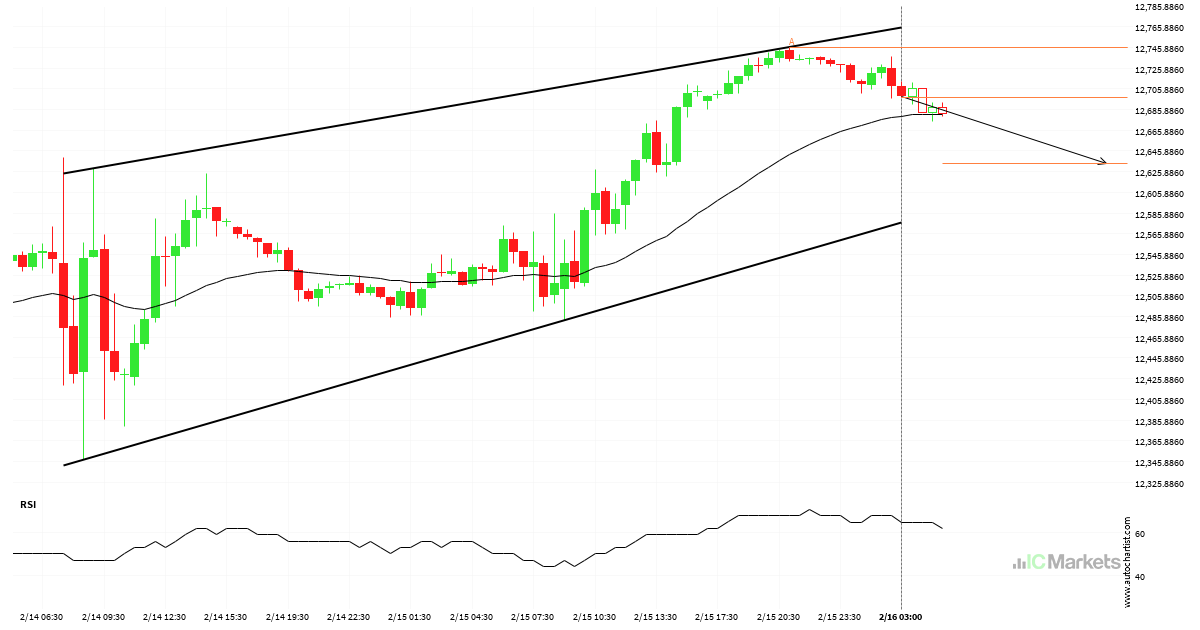
Inminente recuperación o irrupción del US Tech 100 Index
El US Tech 100 Index se dirige a la línea de soporte de un Canal alcista. Si este movimiento se mantiene, el precio de US Tech 100 Index podría probar el nivel de 12634.1702 en las próximas 11 horas. Ya ha probado esta línea en numerosas ocasiones, por lo que este movimiento podría durar poco […]
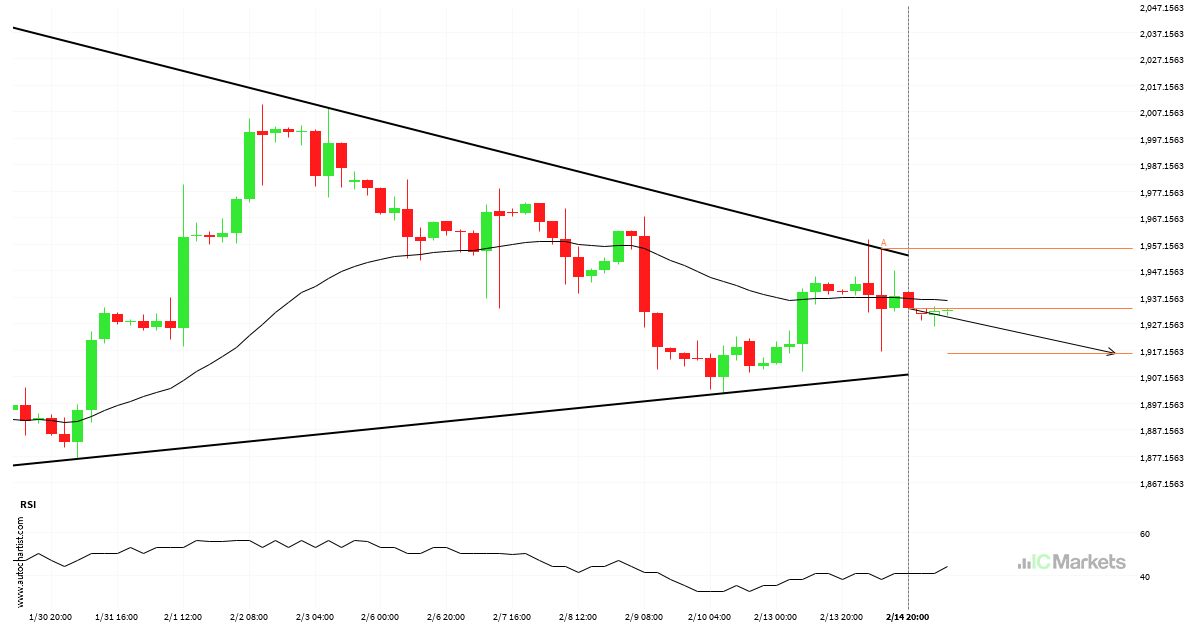
Inminente recuperación o irrupción del US Small Cap 2000 Index
El US Small Cap 2000 Index se dirige a la línea de soporte de un Triángulo. Si este movimiento se mantiene, el precio de US Small Cap 2000 Index podría probar el nivel de 1915.9221 en las próximas 3 días. Ya ha probado esta línea en numerosas ocasiones, por lo que este movimiento podría durar […]
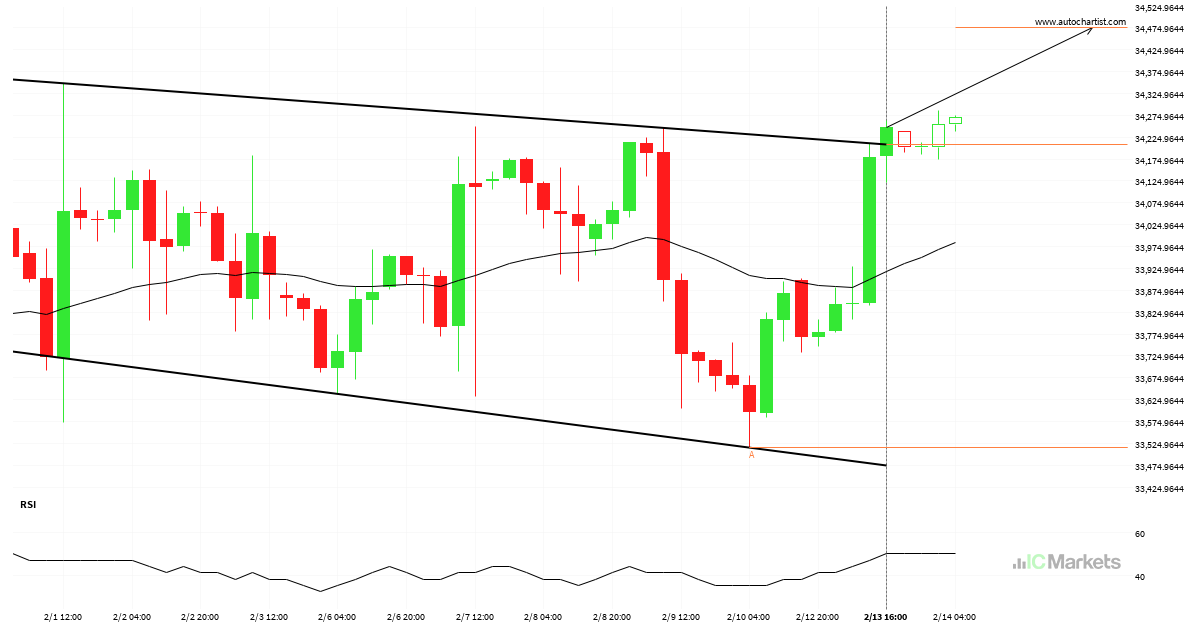
El US Wall Street 30 Index ha atravesado la resistencia
El US Wall Street 30 Index atravesó una línea de resistencia. Ha entrado en contacto con esta línea por lo menos dos veces en 14 días. Esta ruptura puede indicar un movimiento potencial a 34474.9741 en 2 días. Como ya vimos un retroceso de esta posición en el pasado, debemos esperar la confirmación de la […]